
It’s official now: 2016 was the warmest in the last 137 years.
Earth’s surface temperatures in 2016 were the warmest since modern recordkeeping began in 1880, according to separate, independent data analyses by NASA and the National Oceanic and Atmospheric Administration (NOAA).
During 2016, the globally-averaged land surface temperature was 2.57°F (1.43°C).
The average temperature of Earth’s surface and ocean surfaces in 2016 was 1.69°F (0.94°C) above the 20th-century average, according to NOAA. NASA’s findings show that globally-averaged temperatures in 2016 were 1.78°F (0.99°C) warmer than average temperatures in the mid-20th century.
NASA findings also show that 8 of 12 months of 2016, also hit their hottest record. Every month from January to September, with the exception of June, were the hottest on record for those respective months. October, November, and December of 2016 were the second warmest of those months on record – in all three cases, behind records set in 2015, NASA reported.
Credit: NASA
There are slight differences between NASA’s and NOAA’s findings, due to the different types of observations, trackings, and measurements. Besides that, weather station locations and measurement practices change over time, NASA explains. But NASA estimates that 2016 was the warmest year ever with the certainty greater than 95 %.
NASA has collected data from 6,300 weather stations, ship- and buoy-based observations of sea surface temperatures, and temperature measurements from Antarctic research stations in the period of 1951 to 1980.
On the other hand, NOAA has used different baseline period and different methods in analyzing Earth’s both polar and global temperatures.
Global ocean temperature on the rise, poles’ ice levels bellow average
The world ocean is also facing the above-average heat. During 2016, the globally averaged sea surface temperature was 1.35°F (0.75°C) above the 20th-century average.
Global ocean warming has directly affected the amount of ice on the Earth’s poles. Both Arctic and Antarctic have experienced the record lows in sea ice extent during November and December last year, due to unusually high air temperatures and a warm ocean.
The average Arctic sea ice extent in 2016 was 3.92 million square miles, the smallest annual average since record-keeping began in 1979. The average Antarctic sea ice extent for the year was 4.31 million square miles, NOAA reports.
Source: NOAA
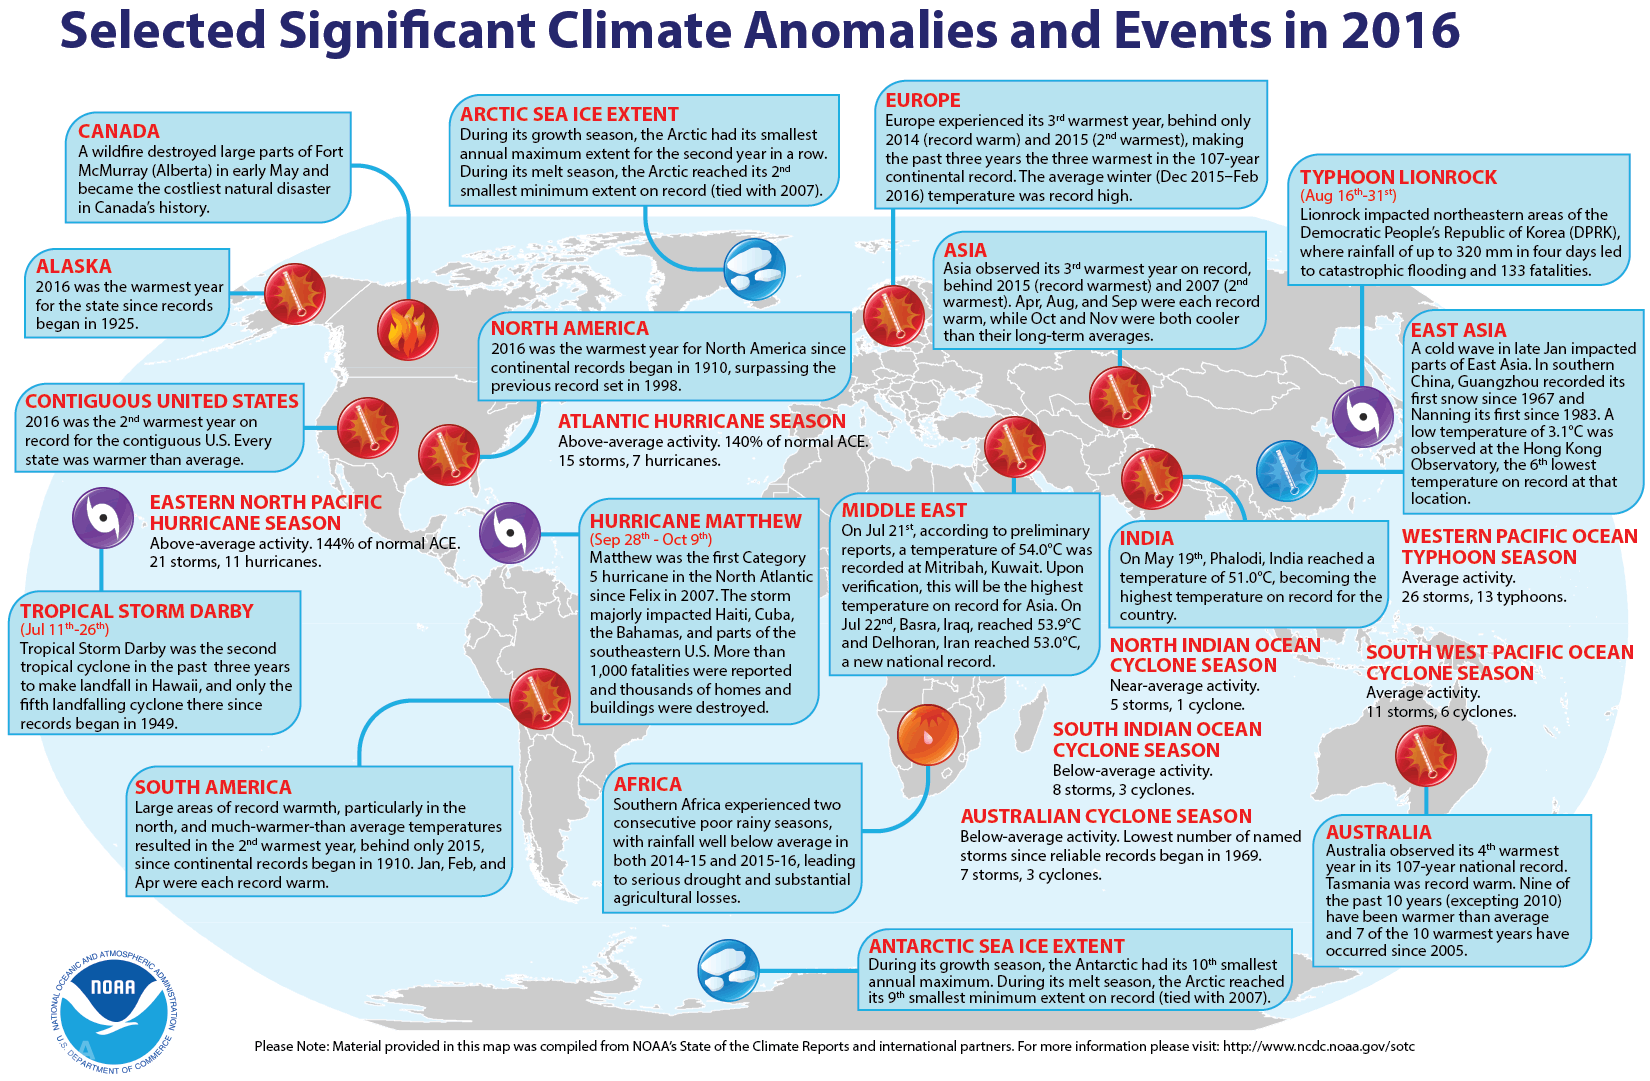
Every corner of the Earth faced the 2016 warmth and circumstances of global warming and climate change. North America had its warmest year on record – 48 states in the U.S. have recorded the highest temperatures.
South America and Africa had their second warmest year ever, Asia and Europe had their third and Australia had its fifth.
Long-term warming trend
A long-term temperature warming trend is obviously continuous. The annual global temperature record has been broken five times during the 21 century – 2005, 2010, 2014, 2015, and 2016. It is clear that 2016 was the third year in a row to set a new record for global average surface temperature.
“2016 is remarkably the third record year in a row in this series,” said GISS Director Gavin Schmidt. “We don’t expect record years every year, but the ongoing long-term warming trend is clear.”
In the last 137 years, the Earth’s average surface temperature has risen about 2.0 degrees F (1.1 degrees C). NASA scientists think that is the result of increasing greenhouse gasses and carbon dioxide, so as other human-made emissions into the atmosphere.
“Pretty much all of the long-term trend that you’re seeing is the result of human activity, and the dominant part of that is the increase in greenhouse gasses, particularly carbon dioxide,” Schmidt said.
The animation bellow shows annual temperatures each year since 1880 compared to the twentieth-century average, ending with record-warm 2016. The animation was provided by NASA.


